Subsistence Fishing Analysis
Overview
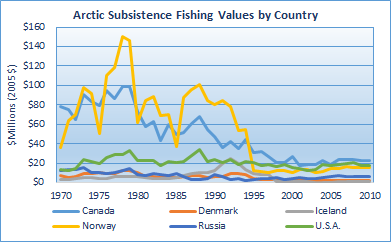
Seaaroundus.org generously provided excellent data on subsistence
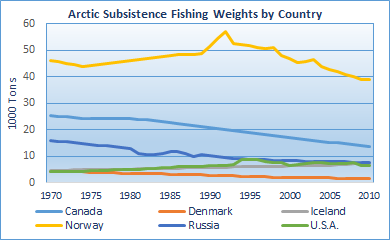
fish harvests for all Arctic nations. Generally, subsistence fishing
by weight has largely been decreasing. Apart from the USA, Iceland, and Canada,
the other Arctic nations have experienced either level or decreasing catch.
Trends

Fishing Values

Fishing Weights
The subsistence fish harvest trends vary by region and nation throughout the Arctic.
These subsistence fishery numbers are a small piece of the greater picture,
but they begin to illuminate an interesting story. In this category,
data are available from 1975 – 2014.
Iceland
46% increase(1975 – 2010)
4,886 tonnes in 1975
7,159 tonnes in 2010
USA (Arctic Alaska)
87% increase(1975 – 2014)
340.97 tonnes in 1975
638.2 tonnes in 2014
Canadian Arctic
12% increase(1975 – 2014)
888.38 tonnes in 1975
993.6 tonnes in 2014
The explanation for these bountiful catches in Iceland, the USA,
and Canada may lie in the behavior of the ocean currents.
The location of Iceland is unique in that it is right in the
transition zone between the cold Transpolar Current and the warm North Atlantic current.
These same currents create a unique transition zone along the Alaskan and Canadian coastlines
in the Beaufort Gyre. Cold and warm water interact in these transition zones to create
bountiful life, thereby leading to thriving fisheries.
The subsistence fish harvest in the other Arctic nations has trended in the opposite direction.
Russia (Laptev to Chukchi Sea)
2% decrease (1975 – 2010)
5,955 tonnes in 1975
5,950.72 tonnes in 2010
Russia (Barents Sea)
98% decrease (1975 – 2010)
233.53 tonnes in 1975
3 tonnes in 2010
Norway
12% decrease (1975 – 2010)
44,357.94 tonnes in 1975
38,758.55 tonnes in 2010
Shifting population dynamics coupled with increased activities in the extractive sectors may be
among the causes of these declines; however, to fully understand the drivers of these changes
in Arctic subsistence fishing, it is necessary to examine estimates within the context of the
Arctic system. There are likely influences and pressures coming from increased human activity
as well as changing ecosystem dynamics in the Arctic ocean as the sea surface temperature rises.
Sami Subsistence Economy
Overview
The Sami people can be found throughout Sweden, Norway, Finland, and Russia. Approximately 63% of the Sami
population are found in Norway; 25% are found in Sweden, 10% in Finland and 3% in Russia [see
population data tab in the Subsistence Economy datasheet]. Although Sami populations still largely follow traditional
subsistence activities, rapid change in the Arctic and general development have placed increased pressures
on the Sami way of life. As with many of the Arctic indigenous communities, data are sparse.
Reindeer Husbandary
Although it makes up a small part of the national economies of Norway, Sweden, Finland, and Russia,
reindeer husbandry is an integral part of the Sami way of life. In Norway, this is the livelihood
of approximately 2600 Sami people. Throughout all 4 countries, approximately 10% of Sami participate
in reindeer husbandry. According to reindeerherding.org, 43% of the total income for reindeer herders
comes from the sale of meat.
Fishing
The other primary subsistence activity of the Sami people is fishing. Although this is an integral part of
Sami subsistence, it seems that indigenous rights are not always considered in establishing effective fisheries
management of inshore fisheries.1 Data are not available for Sami fishing; however, future fisheries policies
should consider the rights of the Sami to ensure their livelihoods are protected.
Diet, Health, + Income
There are interesting peripheral studies that help illuminate the economic situation for the Sami people.
For example, a study conducted for the International Journal of Circumpolar Health titled Dietary Patterns in the
Population Living in the Sami Core Areas of Norway collected demographic and income data in addition to the dietary data.
One possible interpretation of the data is that large percentages of the Sami population studied (as much as 72%) reported
reindeer meat as the most significant portion of their diet, compared with small percentages (10%) for other Norwegians.
Our team compared this to the % of study group consuming reindeer based on income bracket, and noticed that there are
significantly higher percentages in the lower income brackets of NOK 50,000 – NOK 600,000. At income brackets higher than
NOK 600,000, reindeer consumption dramatically drops.2 This suggests that the Sami people, who are the ones consuming
reindeer meat, are in these lower income brackets; this finding supports references in other literature stating that
Sami income levels are low. Although this method may seem to be roundabout, it is logical given the lack of concrete
data available on the Sami population and that it is in line with numerous anecdotal sources. It should be noted that
if the Sami wish to continue living traditional lives, then high income is not essential if there is a preference for
subsistence hunting and fishing.
Industry + the Sami
Perhaps the most relevant perspective from which to consider the Sami subsistence economy is in the context of the other
industries of the Arctic, particularly the extractive industries. Although the status of oil and gas activities is
uncertain as a result of lower oil prices, mineral explorations are ramping up as the Arctic becomes more accessible.3
What is less well-understood is exactly how changes in these industries will impact the Sami people. Some sources suggest
that although the younger Sami generation are exposed to and offered the opportunity to adopt more modern lifestyles, many
are rejecting mainstream jobs in favor of more traditional pursuits.4 This could suggest that although employment opportunities
are made available to the Sami in these extractive industries, they may be reluctant to get involved. Likewise, expansion of
extractive activities has the potential to displace Sami communities. Although in Norway, where there are significantly less
extractive activities happening than in other Arctic nations, there are still significant numbers of oil + gas sites as well
as mines. The Nordic Center for Spatial Development shows 1 major mine site in Northern Norway, where many Sami live. It also
shows numerous other major mine sites in Northern Sweden & Northern Finland, where other Sami live. To fully understand the
impact (cultural as well as environmental) that these extractive industries are having, they should be examined in the context
of their influence on these indigenous populations.
1 Legal Pluralism in Norwegian Inshore Fisheries: Differing Perceptions of Fishing Rights in Sami Finnmark.
maritimestudiesjournal.springeropen.com/articles/10.1186/2212-9790-12-9.
2 "Dietary Patterns in the Sami Population." Journal of Circumpolar Health 67 (2008).
3 "O'Rourke, R. Changes in the Arctic: Background and Issues in Congress. Congressional Research Service, 2016.
4 "Sami - Introduction, Location, Language, Folklore, Religion, Major Holidays, Rites of Passage." World Culture Encyclopedia.
http://www.everyculture.com/wc/Norway-to-Russia/Sami.html.
Russian Subsistence Economy
Overview
Approximately 20% of the Russian population belongs to more than 100 ethnic groups other than Russian.1 Within the
Arctic zone of Russia, there are approximately 40 groups recognized by the government who were included in the 2010 population
census.2 This group of indigenous populations is approximately 260,000 people, dispersed across a massive area of Russian’s
far North, with an average population density of about 3 people per square mile.3

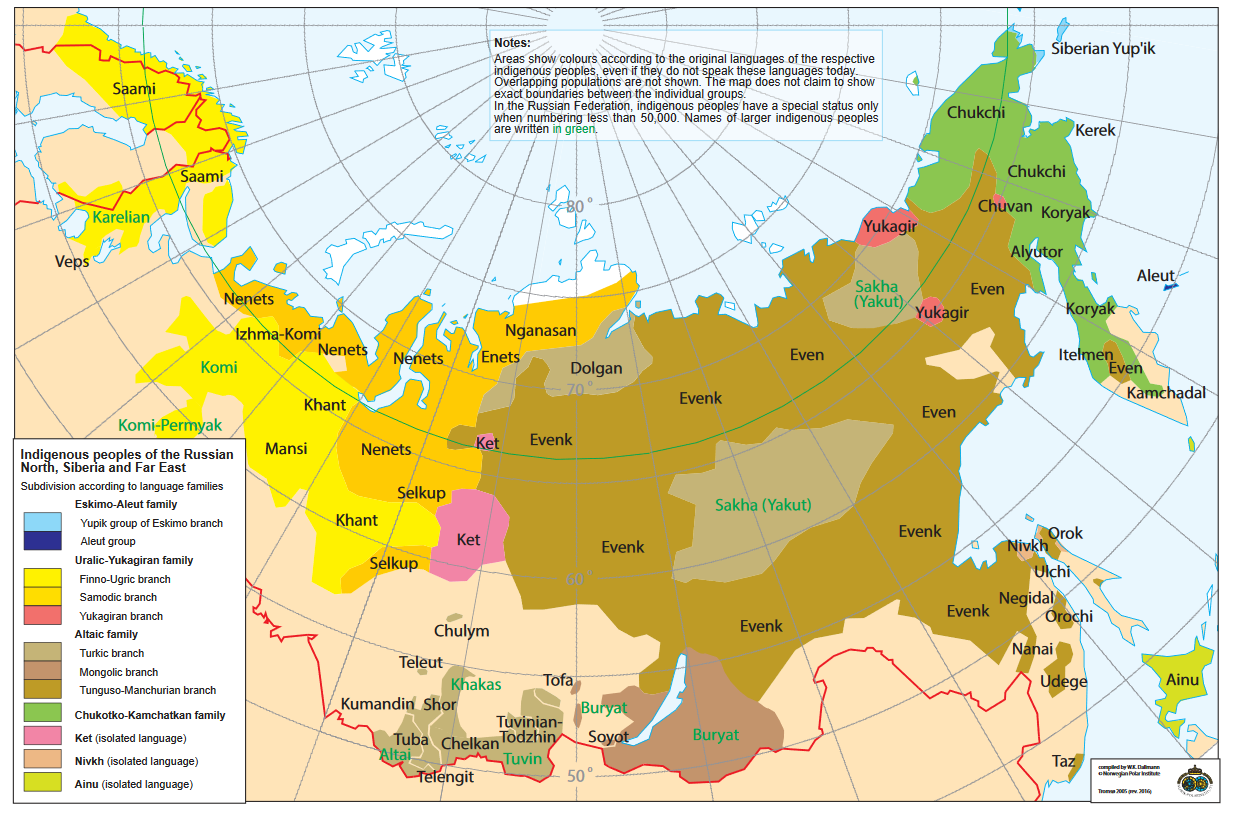
Indigenous Peoples of Russian North, Siberia and Far East. Compiled and drawn by W. Dallmann
As with many indigenous populations in the Arctic, there is sparse economic information available. Despite this lack of solid data,
there are numerous findings and interpretations about the indigenous peoples of Russia’s Far North that provide some indirect evidence.
Subsistence activities among Russian indigenous populations are similar to those of other indigenous populations throughout the Arctic.
These include reindeer herding, hunting, fishing, gathering, vegetable gardening, and livestock & fur farming.4 The interplay
among these subsistence activities and Russian economic development is particularly interesting. The ECONOR 2008 report notes that “in Russia,
when land is allotted to oil companies, reindeer herders only receive compensations for the assumed loss of pastures and reindeer, while the
loss of hunting, fishing and gathering grounds, which represent very important long-term sustainable subsidiary sources of subsistence, is
not compensated."
Population
The Population Data tab show population size of the different indigenous communities in the Far North of Russia from the 1989, 2002, and
2010 censuses. This allows for an easy look at the population changes between these time periods. Although the total indigenous population
grew by 5673 people from 2002 – 2010, there are a number of indigenous groups who experienced sizeable decreases in their total population:
Kety population
2002: 1494
2010: 1219
18.4% decrease
Chulym population
2002: 656
2010: 355
45.7% decrease
Other groups experienced significant population growth:
Nenets population
2002: 41302
2010: 44640
8.1% increase
Chulym population
2002: 2769
2010: 3608
30.3% increase
While this is interesting information taken alone, it is much more illuminating to look at the market data for Russia to see where the bulk
of their development and extractive activities are occurring in relation to indigenous population data. For example, the Sami population of
Russia largely live in the Republic of Karelia and Murmansk Oblast (see Subsistence Economy Graphics). This population shrank by 11% from
2002 – 2010, at the same time there was an approximate 43% increase in iron ore production in the same region.5 Conversely, Russia
began producing diamonds in the Arkhangelsk Oblast region during the 2002-2010 timeframe in an area populated by the Nenets community.
As stated above, the Nenets population grew by 8.1%. Although there may be a lot more at play than simply the interaction between these extractive
industries and the indigenous populations, these findings could suggest that there is some linkage between these two indicators.
A more robust analysis could illuminate more robust details.
Policy
The Russian Federation Government Decree of April 02, 2009 set forth a number of goals “On the Concept of Sustainable Development of Indigenous
Peoples of the North, Siberia, and the Far East of the Russian Federation.” The government stated a goal to collect socio-economic data on indigenous
peoples, but as of the 2010 census (the most recent one published), there is no disaggregated data on socio-economics for indigenous peoples6.
A part of the explanation for this lack of data (and seemingly support) on indigenous peoples can be gleaned from the Russian Federation’s Policy
for the Arctic to 2020. Reading through this document, it is clear that the Russian government has focused on a number of important development
elements in the Arctic, including economic, socio-political, and ecological goals. Indigenous people are only mentioned 3 times throughout these
documents, and with no substantive explanation of how to achieve the goals for this population segment: “h) Improvement of quality of life of the
indigenous population and social conditions of economic activities in the Arctic.”7
1 Glomsrød, Solveig, and Iulie Aslaksen. "The economy of the north 2008." (2008).
2 The Population Data tab of the Subsistence Economy workbook
3 Indigenous Populations. Russian Association of Indigenous Peoples of the North, Siberia, and Far East.
4 Glomsrød, Solveig, and Iulie Aslaksen. "The economy of the north 2008." (2008).
5 "Iron Ore Production." Patchwork Barents. http://patchworkbarents.org/.
6 Indigenous Peoples in Russia. International Working Group for Indigenous Affairs.
7 Russian Federation Policy for the Arctic to 2020. ARCTIS Knowledge Hub.
Greenland Subsistence Economy
Overview
The population of Greenland was 57,728 as of the 2014 census. The indigenous population make up a larger percentage of the
population than in the other Arctic nations, with a slightly larger percentage (89%) of the population identifying as Inuit
than there are living in urban areas (84.7%).1 Inuit Greenlanders call themselves Kalaallit Nunaat.2
Animal Harvest
Subsistence activities represent a large portion of Inuit Greenlanders’ consumption activities. “The typical Greenland diet is
heavy on consumption of fish, potatoes, vegetables, and canned foods. Seal and polar bear meat [and whales] is also a staple
in many Inuit communities”.3 The Greenland Department of Fisheries, Hunting, and Agriculture, as well as Whale and Dolphin
Conservation, collect harvest data for whales and seals. These data4 show:
Minke Whales
harvest averages approximately 152/year.
The Fin Whale
seems to be consistently harvested, although at a much lower quantity.
Humpback whale
harvest in recent years (8 – 10).5
This Humpback harvest does not correspond with a reduction in the harvest of other whales, so there must be something else driving
this new species harvest. Perhaps migration routes are shifting and making Humpbacks accessible to Inuit Greenlanders.
Seal harvest appears to be a much more robust activity in Greenland, with large numbers of Harp, Ringed, and Hooded seals harvested
for subsistence.
Harp
80,696 annual average
1995 - 2006
Ringed
82,421 annual average
1995 - 2006
Hooded
6,4186 annual average
1995 - 2006
During the period analyzed, the total harvest appeared to increase. It seems logical that Greenlanders harvest significantly more
seals than whales, as seals spend part of their time on land and are therefore much easier to hunt. Unfortunately, the data
available for this are from 1995 – 2006. More recent data were not available to indicate current trends.
Fishing
From 1975 to 2010, there has been a significant reduction in fish harvest. In the 1970’s, Greenland harvested roughly 3,000 tons
of fish per year. By 2010, that number had fallen to about 800 tons.
Agriculture
Since agricultural activities have impacts on oceans through run-off, we mention here that reports indicate that Greenland has
experienced an estimated increase of more than 2 weeks to its growing season as well as more than a doubleing of the potato
harvest in recent years between 2008 and 2012.7
These same favorable conditions for agriculture production have likewise (so far) been favorable for traditional reindeer herders, who now have to travel less distance to find grazing areas that are being exposed by warmer conditions.
Because of its largely indigenous population and already apparent climactic changes, Greenland reflects some of the Arctic changes underway. Both the nature of fishing practices and the scale of agriculture are indicative of changes due to climate. Many traditional activities still remain for subsistence purposes.
1 "Greenland Demographics Profile 2016." IndexMundi - Country Facts. http://www.indexmundi.com/greenland/demographics_profile.html.
2 "Culture of Greenland - History, People, Clothing, Women, Beliefs, Food, Customs, Family, Social." World Culture Encyclopedia. Accessed February 14, 2017. http://www.everyculture.com/Ge-It/Greenland.html#ixzz4EmpVwSxF.
3 Ibid.
4 found in the Harvest Data tab in the Subsistence Economy workbook)
5 Whaling in Greenland - WDC. (n.d.). http://us.whales.org/wdc-in-action/whaling-in-greenland
6 Management and Utilization of Seals in Greenland. Greenland Department of Fisheries, Hunting, & Agriculture, 2009.
7 Tomatoes, peppers, strawberries in Greenland's Arctic valleys| Reuters. 2013. http://www.reuters.com/article/us-greenland-climate-agriculture-idUSBRE92P0EX20130326.


