The following FAQs, along with supporting information regarding the concepts and methodologies of the NOEP Market Economy data, are available in the PDF document, "A Guide to the Measurement of the Market Data for the Ocean and Coastal Economy in the National Ocean Economics Program."
- What data are available in the NOEP Market Economy Data Series?
- What is the difference between the OceanEconomy and the Coastal Economy?
- How is "coast" defined?
- How is "ocean" defined?
- Are the Great Lakes included in the definition of the Ocean and Coastal Economies?
- Are rivers and bays included in the definitions of ocean and coastal?
- How are the Ocean and Coastal Economies measured?
- What is Wage and Salary Employment?
- What is Gross Domestic Product (GDP)?
- What are establishments?
- What are the sources of data?
- For what time period are data available?
- How often are the data updated?
- What industries are included in the definitions of the OceanEconomy?
- What are the differences between the pre 2005 Ocean Economy data and data from 2005 to the present?
- Why do the county totals not sum to state totals in the Coastal Economy data?
- What industries are included in the definition of the Coastal Economy?
- What are "SIC" and "NAICS"?
- How do the SIC and NAICS classification systems differ?
- How does the difference between SIC and NAICS affect the measurement of the Ocean and Coastal Economies?
- Why are casinos and refineries coded separately?
- Why are no data shown in many cases?
- Are the county-level OceanEconomy data different from the state-level data?
- Why are Massachusetts' data different?
- What are multipliers and how are they applied to the OceanEconomy?
- How are the forecasts of the Ocean and Coastal Economy prepared?
- Have there been efforts before to define the Ocean and Coastal Economies?
- What are the strengths and weaknesses of the NOEP method for defining the Ocean and Coastal Economies?
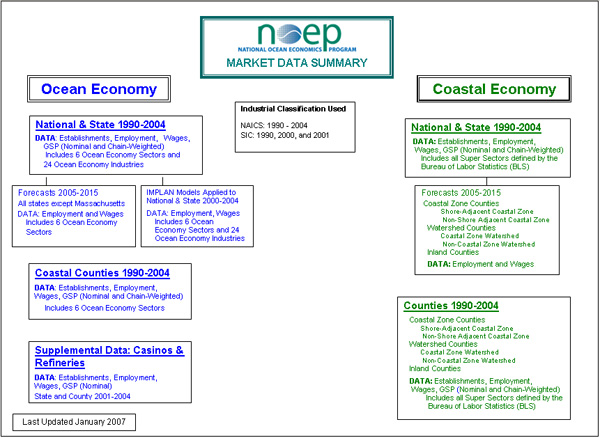
What data are available in the NOEP Market Economy Data Series?
Data on establishments, employment, wages, and gross state product are available for coastal states and counties for 1990-2004 for both the OceanEconomy and Coastal Economy. The following provides a graphic overview of the data.
For an introduction to the available data, see PART II. Detailed Information on the Market Economy Data of the National Ocean Economics Program of the User Guide.
Return to questionsWhat is the difference between the Ocean Economy and the Coastal Economy?
The OceanEconomy is defined as the economic activity, which
indirectly or directly uses the ocean (or Great Lakes) as an input. The
Coastal Economy is defined as all activity, which takes place in the
coastal areas.
For more information, see Defining the Ocean and Coastal Economies
of the
User Guide.
The Coastal Economy definition of NOEP relies on a tiered
approach of geography extending inland from the shorelines of the ocean or
Great Lakes. The definitions of tiers are based on zip code and county
boundaries. The following categories are used starting with the shore-line
and proceeding in an inland direction:
Near-Shore: establishments or population located in a zip code that
is immediately adjacent to an ocean, Great Lake, or included river or bay.
Shore-Adjacent Coastal Zone County: a county touched in whole or in
part by a state's coastal zone for purposes of the Coastal Zone Management
Act of 1972 as defined by that state and which is adjacent to an ocean,
Great Lake, or included river or bay. This includes near-shore zip codes.
Non-shore-Adjacent Coastal Zone County: a county touched in whole
or in part by a state's coastal zone for purposes of the Coastal Zone
Management Act of 1972 as defined by that state and which is not adjacent
to an ocean, Great Lake, or included river or bay.
Coastal Zone Counties: counties comprised of shore-adjacent plus
non-shore adjacent counties. For Illinois, which does not have a Federal
Coastal Zone Management program, the coastal zone counties are defined as
Cook and Lake counties. Both are shore-adjacent.
Non-Coastal Zone Watershed County: a county that is located outside
of the coastal zone, but within a coastal watershed.
Coastal Watershed County: a county located within a coastal watershed
as defined by the U.S. Geological Survey. Watershed counties include all
coastal zone counties and upland counties.
Inland County: a county located outside a coastal watershed.
Return to questions
The concept of the OceanEconomy derives from the ocean (or Great Lakes) being a direct or indirect input to the economic activity. This is defined in part by the definition of an industry (for example, Deep Sea Freight Transportation) and partly by geographic location (for example, a hotel in a coastal town). This leads to the following definition:
An establishment is included in the OceanEconomy when it either:
(1) is included in an industry whose definition explicitly ties the activity to the ocean, or (2) is located in an industry which is partially related to the ocean and is located in a shore-adjacent zip code.
For more information, see Defining the Ocean and Coastal Economies of the User Guide.
Return to questionsAre the Great Lakes included in the definition of the Ocean and Coastal Economies?
Yes, the Great Lakes from Lake Superior to the St. Lawrence River are included in the data set. For purposes of these data, the Great Lakes, Atlantic Ocean, Gulf of Mexico, Pacific Ocean, and Arctic Ocean all are considered "ocean" and the lands abutting them are "coastal."
Return to questionsAre rivers and bays included in the definitions of ocean and coastal?
The following major embayments are used in the definition of Ocean and Coastal economies:
- Penobscot Bay
- Long Island Sound
- Delaware Bay
- Chesapeake Bay
- Albemarle and Pamlico Sounds
- Tampa Bay
- Lake Ponchartrain
- Galveston Bay
- San Francisco Bay and Delta
- Puget Sound
Rivers included in coastal watershed counties are automatically included. In addition, the following major rivers are included in state-defined coastal zones and therefore included as well in the definitions of ocean and coastal:
- The Hudson River from New York City to Albany County
- The Delaware River to Bucks County, Pennsylvania and Monmouth County, New Jersey
- The James, Rappahannock, and York rivers in Virginia and the Potomac River to Alexandria
- The Mississippi River to Baton Rouge Parish in Louisiana
- The American River to Contra Costa County in California
- The Columbia River including Clatsop and Columbia counties in Oregon and Wahkiakum County in Washington.
How are the Ocean and Coastal Economies measured?
Four indicators are used to define the Ocean and Coastal Economies:
- Establishments
- Wage and salary employment
- Wages
- Gross Domestic Product
For more information, see The Basic Data: The Quarterly Census of Employment and Wages of the User Guide.
Return to questionsWhat is Wage and Salary Employment?
In general, most employment is covered by federal and state unemployment insurance laws and these laws govern who reports their employment to the state and federal governments. The NOEP data use these employer-reported data. This definition covers about 90% of employment in the U.S. It excludes farm employment, the military, railroads, and self-employment. The exclusion of self-employment excludes almost all the Fish Harvesting industry's employment, plus self-employed persons in the Tourism & Recreation sector among the ocean economy sectors. Self employment is also excluded from the coastal economy data series.
Wage and salary employment measures employment by place of work, not by place of residence. It also measures jobs, not people. It does not distinguish between full-and part-time work, or year-round and part-year jobs. The data in the NOEP database are annual average employment.
Return to questionsWhat is Gross Domestic Product (GDP)?
The Bureau of Economic Analysis (BEA) defines GDP as follows:
GDP is the value added in production by the labor and property located in a state. GDP for a State is derived as the sum of the gross state product originating in all industries in a State. In concept, an industry's GDP, referred to as its "value added", is equivalent to its gross output (sales or receipts and other operating income, commodity taxes, and inventory change) minus its intermediate inputs (consumption of goods and services purchased from other U.S. industries or imported). The State GDP (formerly called the Gross State Product or GSP) is the state counterpart of the nation's GDP product, BEA's featured measure of U.S. output. In practice, GDP estimates are measured as the sum of the costs incurred and incomes earned in the production of GDP, e.g. the net cost of production. State GDP data are published only at the state-level and for industry aggregations greater than used in the OceanEconomy definition. In order to estimate a share of GDP in an Ocean or Coastal Economy industry, the proportion of the GDP for a given sector is calculated based on the proportion of total wages paid in that sector by a given establishment. The proportion of GDP for a given establishment or industry equals that establishment's or industry's share of total wages. Since wages often account for as much as 60% of GDP, this method is a reasonable approximation of individual establishments' contribution to GDP. Where does the 60% come from?
For more information, see Gross Domestic Product of the User Guide.
Return to questionsEstablishments are simply places of work. Employment is measured by the location of an establishment, not the firm, as there are many firms that have multiple establishments.
Return to questionsEstablishments, employment, and wages are taken from the Quarterly Census of Employment and Wages (QCEW). This data series also is known as the ES-202 data.
These data are based on the quarterly reports of nearly all employers (See What is Wage and Salary Employment?) for more information) in the United States. These reports are filed with each state's employment or labor department, and each state then transmits the data to the Bureau of Labor Statistics (BLS), where the national databases are maintained. The data for the Ocean and Coastal Economies have been taken from the national databases at BLS (except in the case of Massachusetts).
For more information on employment and wages, see The Basic Data: The Quarterly Census of Employment and Wages of the User Guide.
GDP data are taken from the BEA, which develops the estimates of GDP from a number of sources. For more information on GDP, see State Gross Domestic Product of the User Guide.
For more information on Massachusetts, see Why are Massachusetts' data different?)
Return to questionsFor what time period are data available?
Data are available from 1990 to the most recent year in which the federal data sources are available.
Return to questionsHow often are the data updated?
The employment, wage, and establishment data are updated annually, usually in the fall for the previous year. Thus, 2005 employment data will become available in the fall of 2006. However, due to problems accessing location specific data available only at the BLS, OceanEconomy data are only available to 2004. Other methods of estimating the ocean's economic contributions are being developed in order to produce more current data.
Gross domestic product data are available at the industry level about 18 months after the end of the year. GDP data are incorporated into the NOEP data as soon after they become available as possible.
Both the employment and GDP data are subject to periodic revisions by the Bureau of Labor Statistics and Bureau of Economic Analysis. Any revisions by the federal agencies are incorporated in the NOEP data in the course of the annual NOEP updates.
Return to questionsWhat industries are included in the definitions of the OceanEconomy?
The following six sectors comprise the OceanEconomy:
- Construction, Marine
- Living Resources
- Minerals
- Ship & Boat Building
- Tourism & Recreation
- Transportation
The industries comprising these sectors depend on definitions of industries used for government statistical purposes. The measurement of the OceanEconomy has been developed at a time of transition between the Standard Industrial Classification (SIC) and North American Industrial Classification System (NAICS). The NOEP data are provided using NAICS definitions for all years from 1990 on. Data are also available in SIC for 1990, 2000, and 2001 for comparison with other data sets.
For more information, see The SIC and NAICS Industrial Classifications of the User Guide.
Return to questionsWhat are the differences between the pre 2005 Ocean Economy data and data from 2005 to the present?
Changes in Bureau of Labor Statistics confidentiality procedures required changes for the data from 2005 on. These included shifting industries outside of tourism and recreation which had been estimated on a zip-code adjacency basis to a shore county basis and the use of the publicly-available data for tourism and recreation industries for those coastal counties where the entire county is comprised of shore-adjacent zip codes.
These changes affect different counties in different ways so there is no consistent over- or under-estimation of data between the pre-2005 and the 2005-on data Users should use the same care in comparing pre-2005 ocean economy data and post-2004 data as used in comparing SIC and NAICS-based data in other economic data series.
Return to questionsWhy do the county totals not sum to state totals in the Coastal Economy data?
Because the data are drawn from administrative records filed by employers, there is some degree of reporting error. Reports from employers that cannot be identified by either industry or location are classified as "Unknown or unclassified." This category makes up the difference between the sum of county data in a state and the reported state totals.
Return to questionsWhat industries are included in the definition of the Coastal Economy?
The Coastal Economy data in NOEP use the broadest definitions of industrial activity. Under the SIC, data for the following sectors (called "industrial divisions" in the SIC) are available:
- Natural Resources
- Construction
- Manufacturing
- Transport/Utilities
- Wholesale
- Retail
- Finance, Insurance, Real Estate
- Services
- Public Administration
Under NAICS, the following sectors (called "super sectors" in the Bureau of Labor Statistics NAICS-based employment data) are shown:
- Construction
- Education and Health Services
- Financial Activities
- Information
- Leisure and Hospitality
- Manufacturing
- Natural Resources and Mining
- Other Services
- Professional and Business Services
- Public Administration
- Total, all industries
- Trade, Transportation, and Utilities
SIC is the Standard Industrial Classification, which was developed in the 1930s to provide a standard basis for defining industries in government statistical series.
NAICS is the North American Industrial Classification System. It was developed in the 1990s as a part of the North American Free Trade Agreement (NAFTA) to provide a common basis for the U.S., Canada, and Mexico to measure their economic activity.
The transition between SIC and NAICS has been taking place at different times for different government statistical series. Employment related data changed from SIC to NAICS in 2001 when all employers ceased to report their information based on SIC and switched to NAICS. NOEP employment-related data use employer-reported data from 2001 on and a special series of data using NAICS codes for 1990-2000 imputed by the Bureau of Labor Statistics.
GDP related data changed from SIC to NAICS in 2003, but the Bureau of Economic Analysis re-estimated GDP data on a NAICS basis back to 1997.
NOEP data are estimated from the NAICS codes for all years since 1990. Data also are available on an SIC basis for reference purposes for 1990, 2000, and 2001.
For more information, see The SIC and NAICS Industrial Classifications of the User Guide.
Return to questionsHow do the SIC and NAICS classification systems differ?
There are four major differences between the two classification systems:
- Different groupings of industries. For example, under SIC restaurants were included in the Retail sector, while hotels were in the Services sector. Under NAICS they are together in Leisure and Hospitality services.
- More detail. Many industries were divided into smaller groups to provide additional detail in NAICS. For example, casino hotels and all other hotels were combined in SIC, but are separate industries under NAICS.
- More information on services related industries. The single SIC Services industrial division was subdivided into five (5) different services sectors under NAICS.
- A change in the basis of classification. Under SIC, each establishment was classified based on the principal line of business of the firm. Under NAICS, the classification is based on what the establishment does. For example, a ship building firm with its headquarters in one county and its ship yard in another county would have seen both establishments classified as Ship & Building under SIC. Under NAICS, the shipyard would still be a ship building facility, but the headquarters would now be classified under Management.
The NAICS classification provides greater precision in the definition of a number of industries than the SIC. As a result the Ocean Economy definitions under NAICS are able to exclude many establishments with no, or questionable, connection to the ocean. The NAICS estimates tend to be somewhat smaller than SIC estimates as a result.
Both NAICS- and SIC-based definitions of the OceanEconomy are provided for each state (except Massachusetts) in 2001 so that users can compare the two systems.
For more information, see NAICS and Ocean Industries of the User Guide.
For more information on Massachusetts, see Why are Massachusetts' data different?)
Return to questionsWhy are casinos and refineries coded separately?
Casinos and refineries are large industries, often located in coastal areas. However, their connection to the ocean is subject to debate. hence, data on casinos and refineries are presented as separate industries within the sectors so that users can decide whether to include them in their own OceanEconomy data. However, users should note that the large size and small numbers of these establishments make them particularly vulnerable to data suppressions for confidentiality purposes. Thus data on these two industries are shown for only those counties where there are more than three casinos or refineries.
Return to questionsWhy are no data shown in many cases?
Federal law prohibits the publication of any economic data that could reveal the characteristics of a single establishment. The majority of NOEP OceanEconomy data are based on confidential establishment-level data, which are not accessible to the public, and which, must be carefully screened in order to avoid violating federal law. The Coastal Economy data are from publicly available BLS data sources and use a sufficiently high level of industrial aggregation such that data suppressions are rare.
The NOEP data derived from confidential data sources are passed through four (4) levels of screenings. Data for any industry in any location that fails any one test are not shown. ("Region" in these definitions means states or counties.)
- Any industry in any region where there are three (3) or fewer establishments is not shown.
- Any industry in any region that has one (1) establishment comprising 80% or more of employment in that industry and region is not shown.
- If total employment is shown for a region, then it cannot be possible to subtract other industry totals from the regional total to show an industry that has been suppressed. In this case, a second industry must also be suppressed even if it otherwise passes rules 1 and 2. This is called complementary suppression.
- Industry data for a given region cannot be shown in the NOEP database if they are suppressed in any other publicly available BLS database.
For more information, see Confidentiality of the User Guide.
Return to questionsAre the county-level OceanEconomy data different from the state-level data?
The county-level OceanEconomy data are highly subject to data suppressions because many sectors and industries in the Ocean Economy have too few establishments in small counties to be shown. (For more information on data suppressions, see Confidentiality of the User Guide. ) This problem can be reduced, but not eliminated, by taking a different approach to assembling county-level OceanEconomy data from that used in the state- and national-level data. State- and county-level data for ocean sectors and industries are drawn entirely from the confidential establishment data.
For county-level data, two modifications to this procedure are made:
- First, only sector-level data are shown at the county-level; the industry detail available at the state-level is not shown.
- Second, data are drawn from both the confidential establishment data and from the publicly available data. Data for the Ocean Economy total and the Tourism & Recreation sector are taken from the confidential establishment records, as these totals rarely require suppression. Data for the other five (5) OceanEconomy sectors are drawn not from the confidential longitudinal database (LDB) at the Bureau of Labor Statistics, but from the public data set for the Quarterly Census of Employment and Wages, available from BLS. This database already has been screened for suppressions, and permits more ocean-related data to be shown at the county-level than could be shown if the confidential data set were used.
Users should be cautious about using the county-level data. The OceanEconomy and Tourism & Recreation sector are available in almost all counties for every year, but the data may be sporadically available or unavailable in smaller sectors (such as Construction and Minerals) in many counties.
In addition, the use of two different databases means that even if all sectors and industries are present the totals will not necessarily sum to the OceanEconomy totals. Users should always use the reported OceanEconomy totals when available rather than attempting to sum sectors or industries at the county-level.
For more information, see The Basic Data: The Quarterly Census of Employment and Wages of the User Guide.
Return to questionsWhy are Massachusetts' data different?
The data on employment and wages are a cooperative state-federal program, and the states have some discretion over how the data are used. Massachusetts is one of a handful of states (and the only coastal state) whose legislature prohibits outside researchers from accessing its confidential establishment data.
Massachusetts OceanEconomy data in the NOEP data series are estimated using an approach that is similar in concept to the estimates in other states, but uses only publicly available data. It is somewhat less accurate than the other states, but is sufficiently comparable for inclusion in the overall data series.
For more information, see Massachusetts of the User Guide.
Return to questionsWhat are multipliers and how are they applied to the OceanEconomy?
The total economic role of a given industry in a given region is the sum of its direct, indirect, and induced activity. Using employment as an example, direct activity is the employment in the industry itself. Indirect employment is the employment in firms within the region who supply goods and services to the industry. Induced employment is the employment affected by the spending of the direct and indirect employment within the region for the purchases of food, cars, services, etc.
The total economic influence of a given industry's employment in a given region is thus defined as:
Total Employment = Direct Employment + Indirect Employment + Induced Employment.
The sum of indirect and induced employment is referred to as the "multiplier." Total employment may thus also be defined as:
Total Employment = Direct employment * multiplier
Where the multiplier = 1 + (Indirect + Induced Employment)
Direct Employment
The same equivalency can be defined for wages and GDP. The relationship between direct activity and total economic influence is defined as the multiplier effect.
The multiplier effect can be estimated a number of different ways. NOEP uses a regional economic model called IMPLAN, which is commonly used for this type of analysis in a large number of settings. Multiplier effects are calculated for all OceanEconomy sectors and industries at the state and national level.
Note that except in the specific data series labeled as "multipliers," all employment, wage, and GDP data in the NOEP market database refer to direct employment, wages, and GDP.
For more information, see Multiplier Estimation: Economic Impacts of the OceanEconomy of the User Guide.
Return to questionsHow are the forecasts of the Ocean and Coastal Economy prepared?
The forecasts of Ocean and Coastal Economic data are in cooperation with Moody's/Economy.com, a leading provider of economic data and forecasting services. Coastal Economy forecasts in NOEP show the population, employment, wage, and GDP forecasts for the county-based regions (coastal zone counties, watershed counties, upland counties, and inland counties). County-level forecasts are not shown in the NOEP database as they are the property of Moody's/Economy.com.
OceanEconomy forecasts are currently shown at the state-level for the OceanEconomy sectors and for the total Ocean Economy. Data are available for employment, total wages, and gross state product. The OceanEconomy forecasts are prepared by NOEP based on the industry level forecasts prepared by Moody's/Economy.com. Forecasting models are fit for each sector in each state and the Ocean Economy forecast is the sum of the individual sector forecasts.
Forecasts currently available from NOEP are based on the August 2005 forecast prepared by Moody's/Economy.com. These forecasts do not include the effects of the hurricanes that affected Florida and the Gulf of Mexico states in August and September 2005.
For more information, see Forecasts of the User Guide.
Return to questionsHave there been efforts before to define the Ocean and Coastal Economies?
There have been a number of efforts to define Ocean and Coastal Economic activities beginning in 1974. For more information about previous studies and their relationship to the NOEP, see Previous Studies of the User Guide.
Return to questionsThe principal strength of the NOEP data is consistency across time and space. Unlike many studies of the Coastal and Ocean Economies, which have used ad hoc methods and definitions, and which, have thus not produced comparable data, the NOEP data use definitions and methods that are as consistent as possible across all states and across multiple years. Thus, it is possible to measure change over time and to compare one coastal region to another, and one sector to another, with reasonable accuracy.
The NOEP approach also allows greater precision over any other approach in geographic and industrial definitions by using the original source data at the establishment-level to create customized definitions uniquely suitable to the concept of an OceanEconomy.
The principal weaknesses lie in the data series used for measurement.
- Key definitions like the industrial classifications have changed.
- Many industries are still too aggregate for true "ocean" economy measurement.
- Shore-adjacent zip code is an imperfect geographic unit for the purpose of defining location.
In addition, certain ocean-related activities are excluded from the data sets used for measurement. These include the Fish Harvesting industry (which is not covered by unemployment insurance laws), the Government sector, Scientific and Education Research, and Coastal Real Estate, none of which report employment in a way that ocean-related activity can be separated from other activities.For more information, see Strengths and Weaknesses of the NOEP Methodology of the User Guide.
Return to questionsupdated 15-May-2013